

Microsoft Power BI is a cloud-based Business Intelligence platform that helps you transform massive amounts of data into meaningful, actionable insights. With an integrated ecosystem of services, apps, and connectors, Power BI unifies your data—in any format and from any source—into interactive dashboards and rich visual reports that drive confident decision-making across your organization.
Power BI connects seamlessly to hundreds of data sources, allowing users at every level to visualize trends, uncover patterns, and share insights instantly. No advanced technical background is required—Power BI empowers everyone to create sophisticated analytics experiences with ease.
For more than a decade, organizations of all sizes and industries in Saudi Arabia have trusted Power BI to modernize their analytics. We’ve helped SMBs and enterprises across the Kingdom create data-driven cultures, deliver real-time dashboards, and use predictive insights to move faster than ever before.
Power BI is made up of several key components designed to support the full analytics lifecycle:
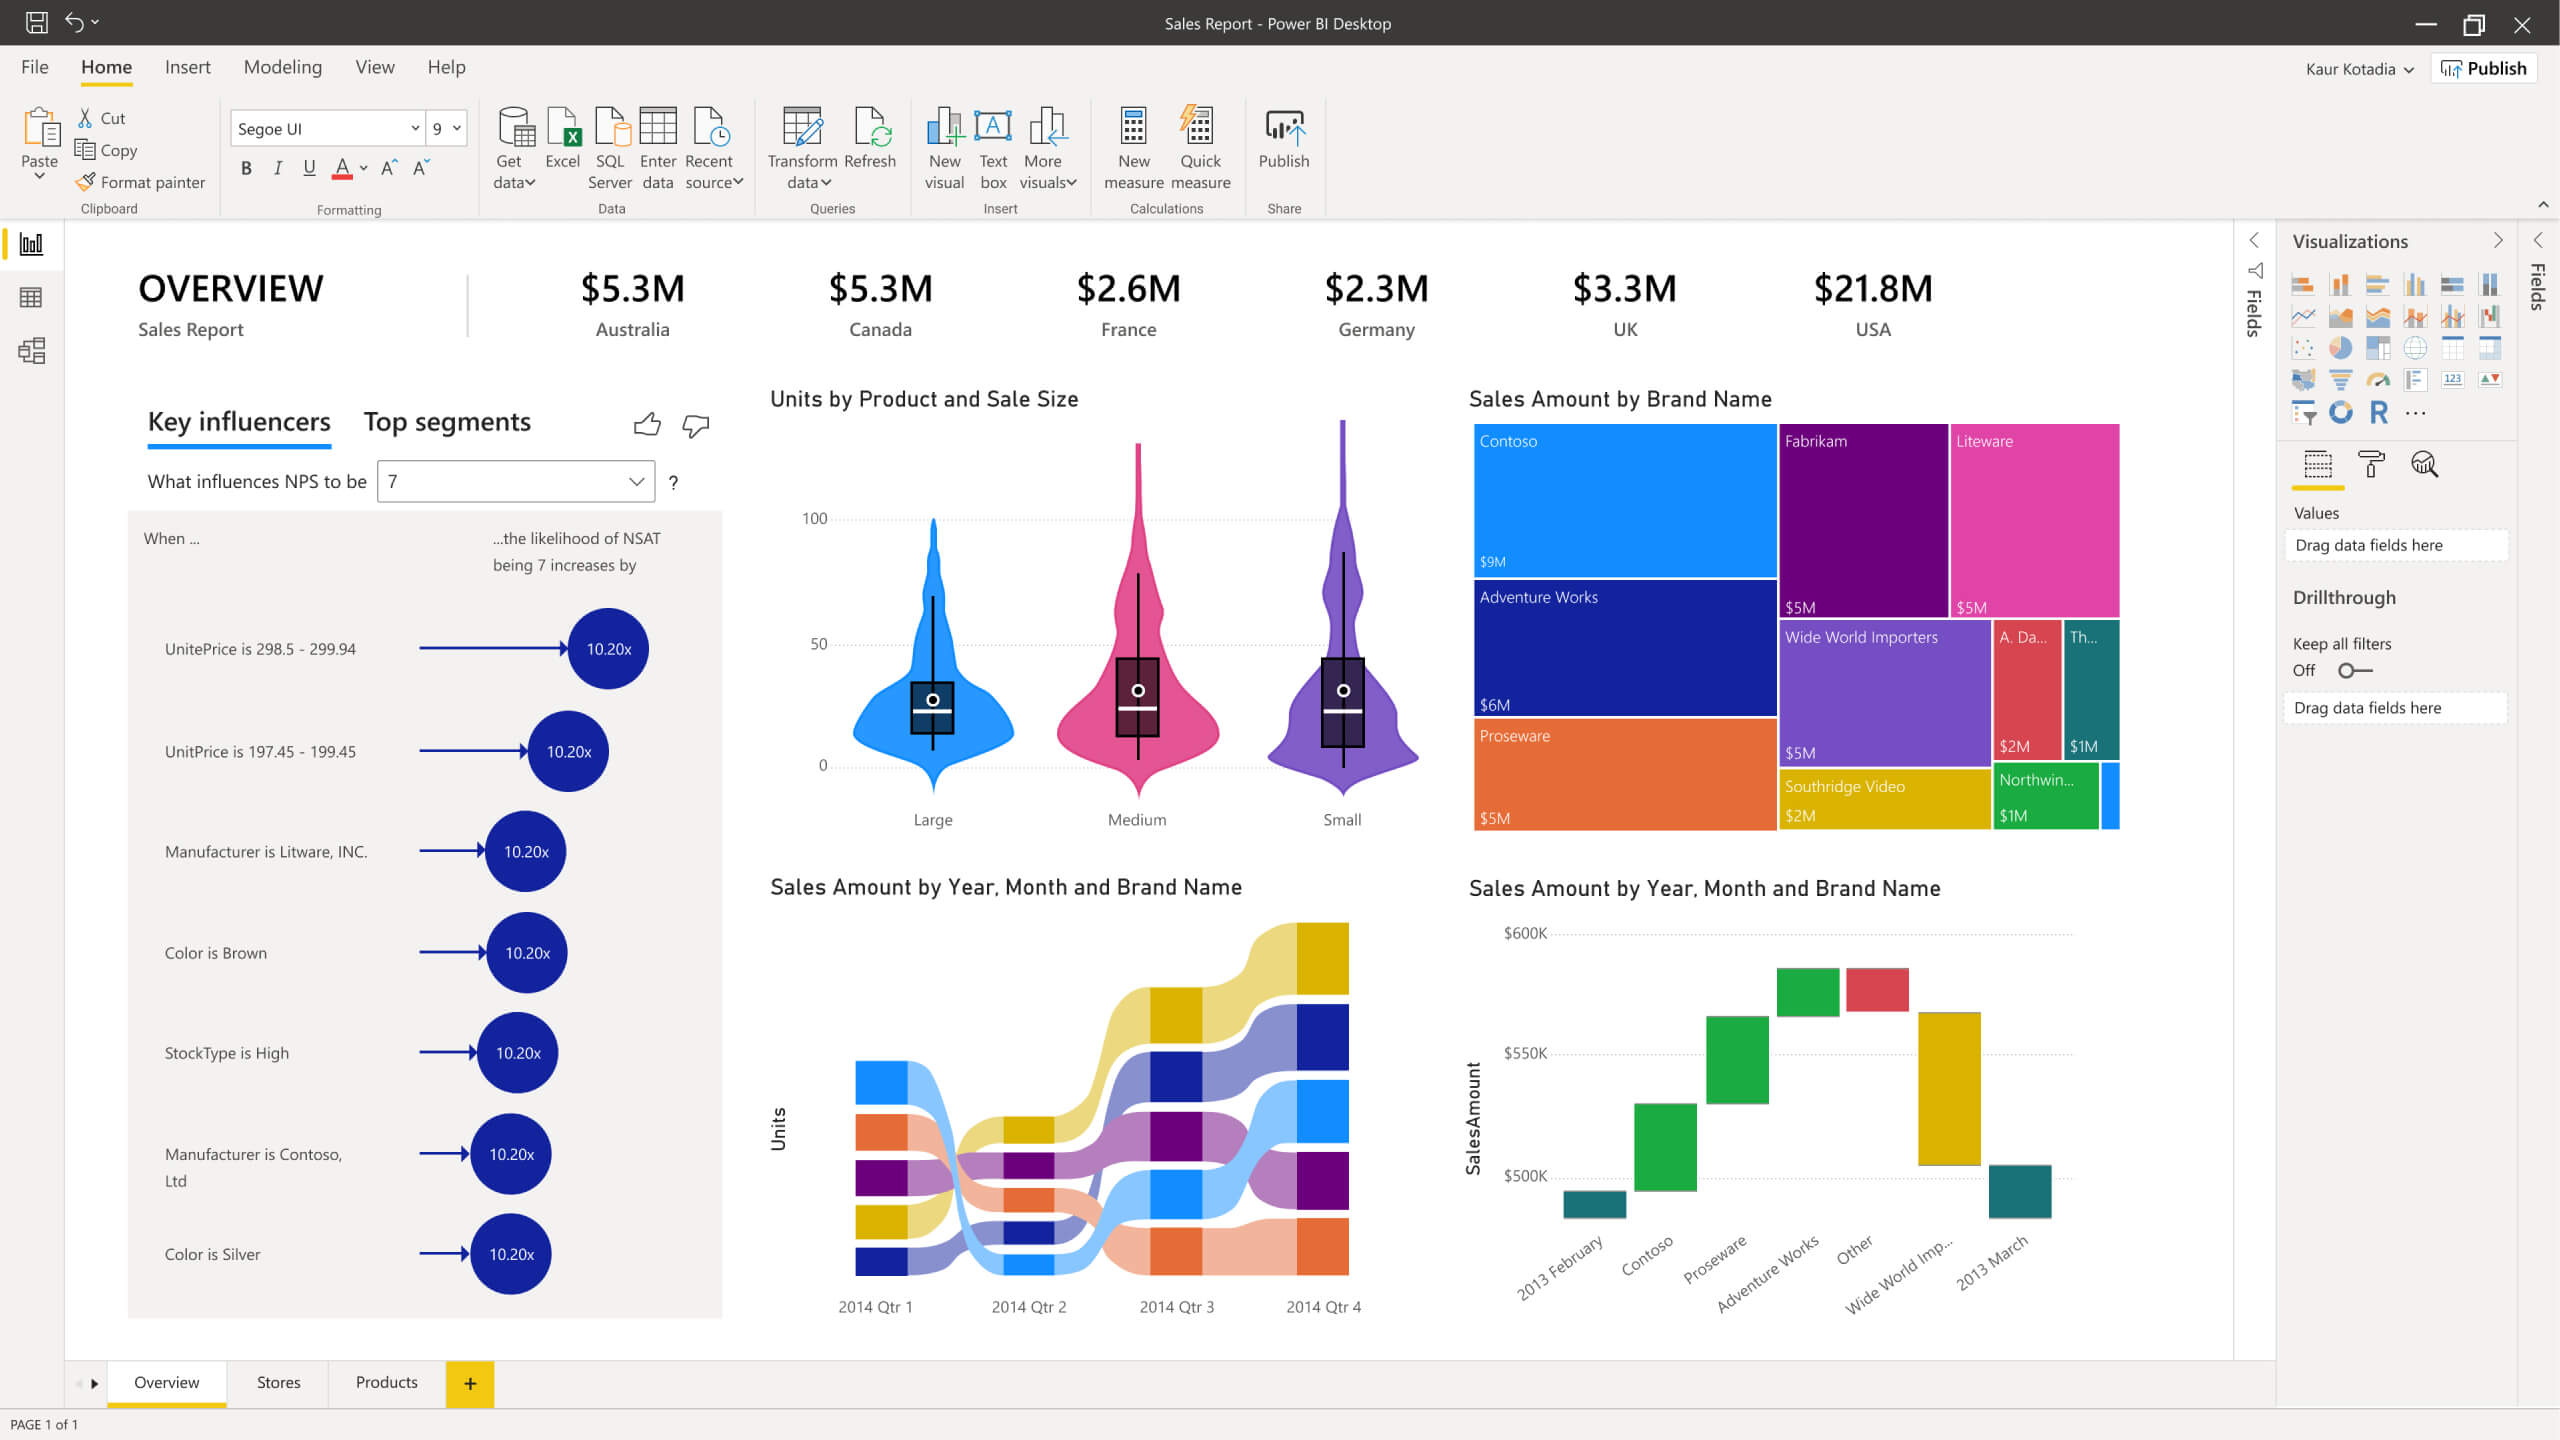
A Windows desktop application where you can connect to data sources, model your data, and build interactive visual reports.
A cloud-based online service where dashboards can be shared, consumed, and collaborated on across your organization.
Available for iOS, Android, and Windows—giving secure, on-the-go access to your reports and dashboards.
An on-premises reporting solution for organizations that need to keep their data and reporting infrastructure within their own environment.
Reduce complexity and unify all your analytics needs on one secure, scalable platform.
Protect analytics data with advanced sensitivity labeling and data loss prevention policies—even when exported.
- Leverage hundreds of visuals, built-in AI, seamless Excel integration, and prebuilt connectors to explore data intuitively.
- Find and share meaningful insights with hundreds of data visualizations, built-in AI capabilities, tight Excel integration, and prebuilt and custom data connectors.
Quickly connect Excel queries and models to Power BI dashboards for deeper insight and seamless reporting.Anyone who’s familiar with Office 365 can easily connect Excel queries, data models, and reports to Power BI Dashboards - helping to quickly gather, analyze, publish, and share Excel business data in new ways.
Prepare data, build machine learning models, and uncover insights from structured or unstructured data—including text and images.
Take advantage of the latest advances in Microsoft AI to help non-data scientists prepare data, build machine learning models, and find insights quickly from both structured and unstructured data, including text and images.
Go from data to insights and insights to action with the Microsoft Power Platform - combining Power BI with Power Apps and Power Automate to easily build business applications and automate workflows.
Bring together semantic models, ALM toolkits, pixel-perfect reports, and live streaming data—from IoT to social platforms—so you can make confident, instant decisions on a single integrated platform.
Power BI Desktop is free, and Power BI Pro offers cost-effective analytics capabilities for every user in your organization.
Simplify how you analyze and share large volumes of data. By using a no-limits Azure data lake, you’ll reduce the time it takes to get insights and increase collaboration between business analysts, data engineers, and data scientists.
Support for R/Python visuals in Embed for Your Customers and Publish to Web will end in May 2026. After this date, these visuals will appear blank.
Embed for your organization and secure embedding remain fully supported.
A completely new mobile Copilot experience enables natural-language chat, instant visual insights, and even voice dictation (iOS).
Generate complete report pages with richer visuals, better context understanding, and more accurate insights—now in Desktop and Service.
Matrix visuals can now intelligently distribute space across columns for cleaner layouts.
New states (hover, pressed), borders, backgrounds, shapes, and flexible image sources bring richer storytelling to reports.
Easily browse, filter, and select Fabric user-defined functions within translytical task flows.
Supports hero images, dynamic collage layouts, custom ordering, and modern formatting—offering a fresh, unified design experience.
Automatically captures up to five versions with easy restore—similar to Office versioning.
Includes DAX highlighting, Power Query support, code formatting, and localization for Power BI projects.
Rebuilt using ADBC for faster, safer, and more efficient connections across Fabric and Desktop environments.